Cleaning data
- changing text to lowercase:
- changing text to uppercase:
- capitalizing the first letter of a text string:
- capitalizing the first letter of all the words in a text string:
- removing '?' and '!' from the text string:
- performing addition, subtraction, multiplication, and division on the numbers in a column:
- performing arithematic calculations on the same column:
- renaming columns:
- find non-numeric values in columns:
- count the number of numeric and non-numeric values:
- changing data:
- count the occurrences of '?' or missing values in each column
- to filter the occurrences of '?' or missing values in certain columns:
- to filter columns with '?' or missing values:
- to drop all the rows with missing values in all columns:
- find out the mean a column:
- replacing missing data with the mean of the column:
- replacing missing data with the mean for several columns:
- find out the mode of all columns: (after replacing or dropping '?' and missing values)
- find out the unique values and their count in a column:
- rename the title and index of drive_wheels_counts:
- find out the mode of a column:
- replace the missing values with the mode of a column:
- replace all missing data with frequency:
- drop all rows with missing data in the "price" column:
- convert 'normalized_losses' to integer:
- normalizing data Simple Feature Scaling:
- binning data with pandas:
- binning data with matplotlib:
- creating dummy variables:
- rounding numbers using numpy:
- print missing data in the format - missing count/total rows
text = "Hello World"
lowercase_text = text.lower()
print(lowercase_text)text = "Hello World"
uppercase_text = text.upper()
print(uppercase_text)text = "hello world"
capitalized_text = text.capitalize()
print(capitalized_text)text = "hello world"
titlecased_text = text.title()
print(titlecased_text)text = "Hello! How are you? I'm fine."
cleaned_text = text.replace('!', '').replace('?', '')
print(cleaned_text)import pandas as pd
# Sample DataFrame
data = {'A': [1, 2, 3, 4, 5]}
df = pd.DataFrame(data)
# Addition
df['B'] = df['A'] + 10
# Subtraction
df['C'] = df['A'] - 3
# Multiplication
df['D'] = df['A'] * 2
# Division
df['E'] = df['A'] / 2
print(df)df['A'] = df['A'] - 10import pandas as pd
# Sample DataFrame
data = {'A': [1, 2, 3], 'B': [4, 5, 6]}
df = pd.DataFrame(data)
# Renaming columns
df.rename(columns={'A': 'Column1', 'B': 'Column2'}, inplace=True)
print(df)import pandas as pd
# Example DataFrame
data = {'col1': [1, 2, 'a', 4, 5],
'col2': [6, 'b', 8, 9, 10]}
df = pd.DataFrame(data)
# Convert columns to numeric and check for non-numeric values
for column in df.columns:
numeric_column = pd.to_numeric(df[column], errors='coerce')
non_numeric_values = df[numeric_column.isna()][column]
if not non_numeric_values.empty:
print(f"Non-numeric values found in column '{column}':")
print(non_numeric_values)
else:
print(f"No non-numeric values found in column '{column}'")import pandas as pd
# Example DataFrame
data = {'col1': [1, 2, 'a', 4, 5],
'col2': [6, 'b', 8, 9, 10]}
df = pd.DataFrame(data)
# Initialize dictionaries to store counts
numeric_counts = {}
non_numeric_counts = {}
# Iterate over each column
for column in df.columns:
# Convert column to numeric type
numeric_column = pd.to_numeric(df[column], errors='coerce')
# Count numeric values
numeric_count = numeric_column.notna().sum()
numeric_counts[column] = numeric_count
# Count non-numeric values
non_numeric_count = df[column].notna().sum() - numeric_count
non_numeric_counts[column] = non_numeric_count
# Display counts
for column in df.columns:
print(f"Column '{column}':")
print(f" Numeric: {numeric_counts[column]}")
print(f" Non-numeric: {non_numeric_counts[column]}")import pandas as pd
data = {'col1': [1, 2, 'a', 4, 5],
'col2': [6, 'b', 8, 9, 10]}
df = pd.DataFrame(data)
# change row 3, col 1 to '7'
df.at[2, 'col1'] = 7# count the occurrences '?' in each column
question_mark_counts = (df == '?').sum()
# filter the columns with '?' values in a dataframe
columns_with_question_mark = question_mark_counts[question_mark_counts > 0]
columns_with_question_mark
# count the number of missing values in each column
missing_counts = df.isna().sum()
# Filter columns with missing values
columns_with_missing_values = missing_counts[missing_counts > 0]
print(columns_with_missing_values)# replace "?" to NaN
df.replace("?", np.nan, inplace = True)
# show columns with counts of missing data
missing_counts = df.isna().sum() # same as df.isnull().sum()
missing_counts[missing_counts > 0]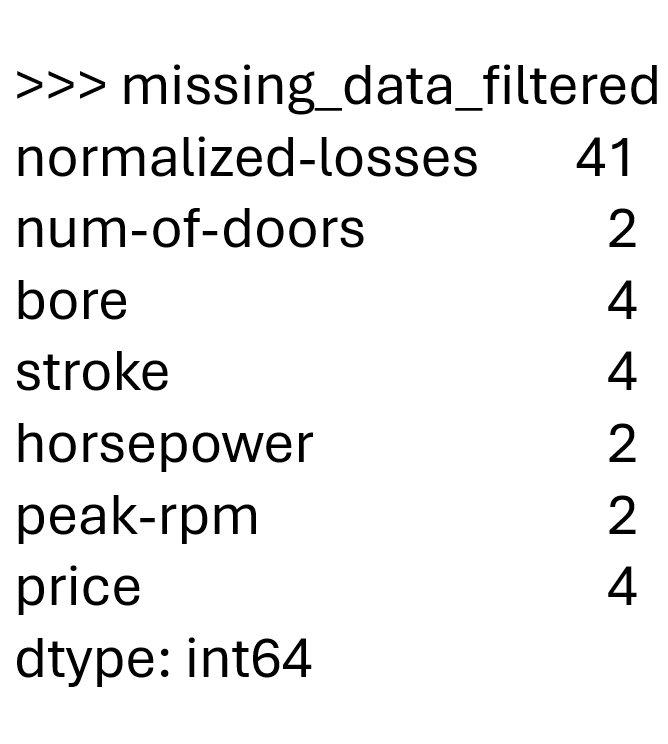
import pandas as pd

# Check for '?' in the specified columns
contains_question_mark = df[['length', 'width', 'height']].eq('?').any()

# Check for missing values in the specified columns
missing_values = df[['length', 'width', 'height']].isnull().any()

# Combine the results
result = missing_values | contains_question_mark
print(result)# change ? to NaN
df.replace("?", np.nan, inplace = True)
# Showing only rows and columns where missing values exist
df_missing = df[df.isnull().any(axis=1)]
df_missing = df_missing.loc[:, df_missing.isnull().any(axis=0)]
print(df_missing)df = df.dropna(axis=0)# Convert "normalized-losses" column to numeric type
df["normalized-losses"] = pd.to_numeric(df["normalized-losses"], errors='coerce')
# Calculate the mean of "normalized-losses" column
mean_normalized_losses = df["normalized-losses"].mean()
print("Mean of normalized-losses column:", mean_normalized_losses)avg_norm_loss = df["normalized-losses"].astype("float").mean(axis=0)
print("Average of normalized-losses:", avg_norm_loss)df['normalized-losses'].replace(np.nan, avg_norm_loss, inplace= True)# replace "?" to NaN
df.replace("?", np.nan, inplace = True)
columns_to_impute = ["normalized-losses", "bore", "stroke", "horsepower", "peak-rpm"]
# change the columns_to_impute to float64
df[columns_to_impute] = df[columns_to_impute].astype("float64")
# Calculate the mean of each column
means = df[columns_to_impute].mean()
# Replace missing values with the mean of their respective column
df[columns_to_impute] = df[columns_to_impute].fillna(means)# Dictionary to store column names and their most frequent values
most_frequent_values = {}
# Iterate over columns to find the most frequent value in each column
for column in df.columns:
most_frequent_values[column] = df[column].value_counts().idxmax()
# Create a DataFrame from the dictionary
most_frequent_df = pd.DataFrame.from_dict(most_frequent_values, orient='index', columns=['Most_Frequent_Value'])
print(most_frequent_df)# unique value
df['num-of-doors'].unique()
# count of unique values in the column
df['num-of-doors'].value_counts()
# convert the series to a dataframe
drive_wheels_counts = df['drive-wheels'].value_counts().to_frame()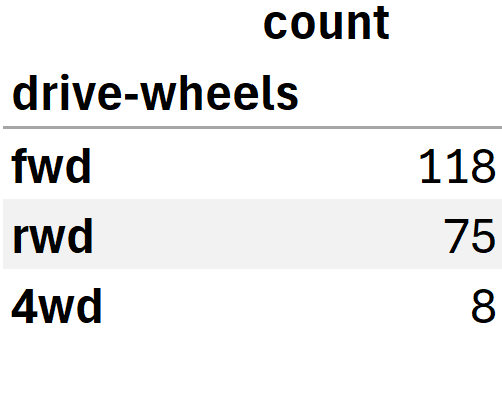
drive_wheels_counts.rename(columns={'count': 'drive-wheels'}, inplace=True)
drive_wheels_counts.index.name = 'count'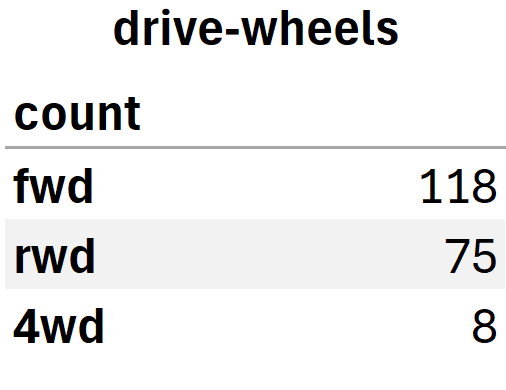
# find out the most frequent value in the column
df['num-of-doors'].value_counts().idxmax()# replace the missing 'num-of-doors' values by the most frequent
df["num-of-doors"].replace(np.nan, "four", inplace=True)# Replace missing values with the most frequently occurring value
df_filled = df.fillna(df.mode().iloc[0])
# Display the dataframe after filling missing values
print(df_filled.head())# drop all rows that contain missing values in the price column
df.dropna(subset=["price"], axis=0, inplace=True)
# reset index, because we droped two rows
df.reset_index(drop=True, inplace=True)df[["normalized-losses"]] = df[["normalized-losses"]].astype("int")import pandas as pd
# Assuming df is your DataFrame
# Column names to normalize
columns_to_normalize = ['length', 'width', 'height']
# Simple feature scaling
df[columns_to_normalize] = df[columns_to_normalize] / df[columns_to_normalize].max()# Assuming df is your DataFrame
# Column names to normalize
columns_to_normalize = ['length', 'width', 'height']
# Min-Max scaling
df[columns_to_normalize] = (df[columns_to_normalize] - df[columns_to_normalize].min()) / (df[columns_to_normalize].max() - df[columns_to_normalize].min())# Assuming df is your DataFrame
# Column names to normalize
columns_to_normalize = ['length', 'width', 'height']
# Z-score scaling
df[columns_to_normalize] = (df[columns_to_normalize] - df[columns_to_normalize].mean()) / df[columns_to_normalize].std()
import pandas as pd
import numpy as np
import matplotlib.pyplot as plt

url = 'https://cf-courses-data.s3.us.cloud-object-storage.appdomain.cloud/IBMDeveloperSkillsNetwork-DA0101EN-SkillsNetwork/labs/Data%20files/auto.csv'
df = pd.read_csv(url, header=None)

df.columns = ["symboling", "normalized-losses", "make", "fuel-type", "aspiration", "num-of-doors", "body-style",
"drive-wheels", "engine-location", "wheel-base", "length", "width", "height", "curb-weight", "engine-type",
"num-of-cylinders", "engine-size", "fuel-system", "bore", "stroke", "compression-ratio", "horsepower",
"peak-rpm", "city-mpg", "highway-mpg", "price"]

# Replace '?' with np.nan
df.replace("?", np.nan, inplace=True)

# Convert 'price' to numeric, coercing any errors to NaN
df['price'] = pd.to_numeric(df['price'], errors='coerce')

# Now, you can safely compute the bins since 'price' is fully numeric
bins = np.linspace(min(df['price']), max(df['price']), 4)
group_names = ['Low', 'Medium', 'High']
df['price-binned'] = pd.cut(df['price'], bins, labels=group_names, include_lowest=True)

# If you want to drop rows with NaN in 'price' before binning (optional)
df.dropna(subset=['price'], inplace=True)

# Recalculate bins since NaNs are dropped
bins = np.linspace(min(df['price']), max(df['price']), 4)
df['price-binned'] = pd.cut(df['price'], bins, labels=group_names, include_lowest=True)

# Count the occurrences of each bin
bin_counts = df['price-binned'].value_counts()

# Sort the index to ensure the bars are in the correct order
bin_counts = bin_counts.sort_index()

# Create a bar plot for the binned data
plt.bar(bin_counts.index, bin_counts.values, color=['blue', 'orange', 'green'])
plt.xlabel('Price Category')
plt.ylabel('Frequency')
plt.title('Distribution of Price Categories')
plt.show()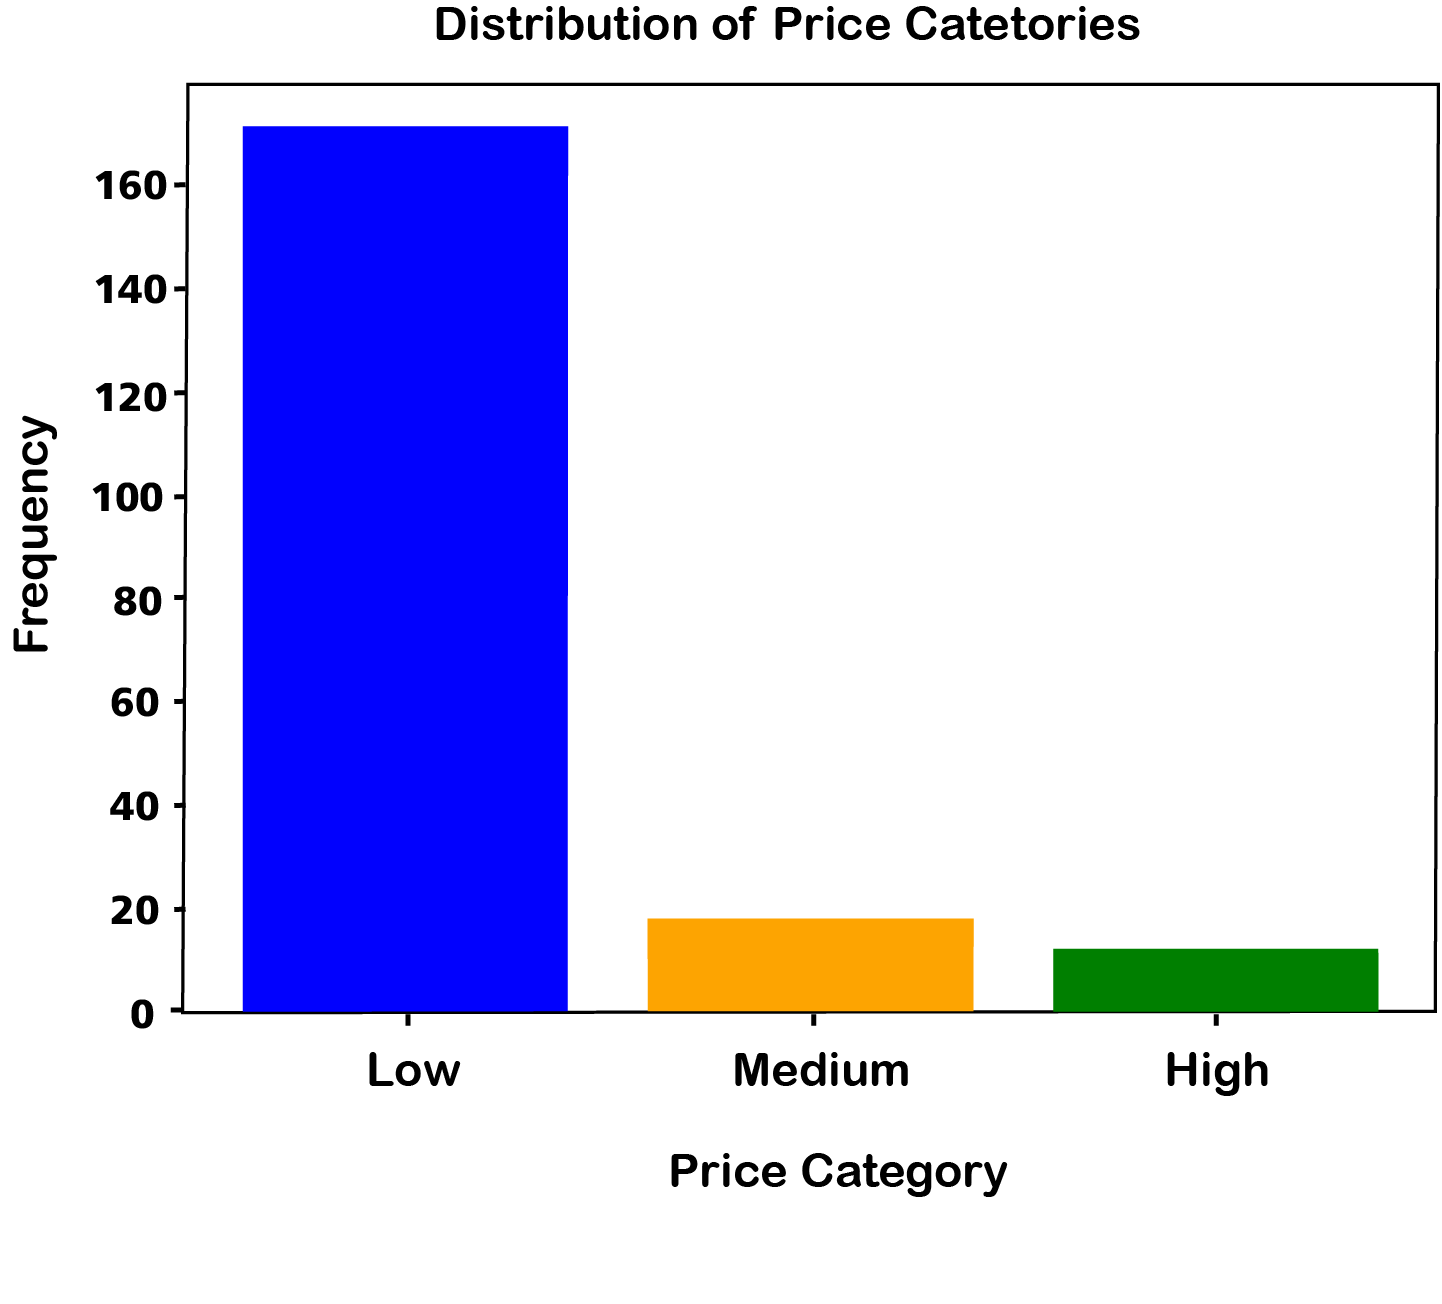
or using pyplot:
bins = np.linspace(min(df["horsepower"]), max(df["horsepower"]), 4)

group_names = ['Low', 'Medium', 'High']
df['horsepower-binned'] = pd.cut(df['horsepower'], bins, labels=group_names, include_lowest=True )
df[['horsepower','horsepower-binned']].head(20)
df["horsepower-binned"].value_counts()

%matplotlib inline
import matplotlib as plt
from matplotlib import pyplot
pyplot.bar(group_names, df["horsepower-binned"].value_counts())

# set x/y labels and plot title
plt.pyplot.xlabel("horsepower")
plt.pyplot.ylabel("count")
plt.pyplot.title("horsepower bins")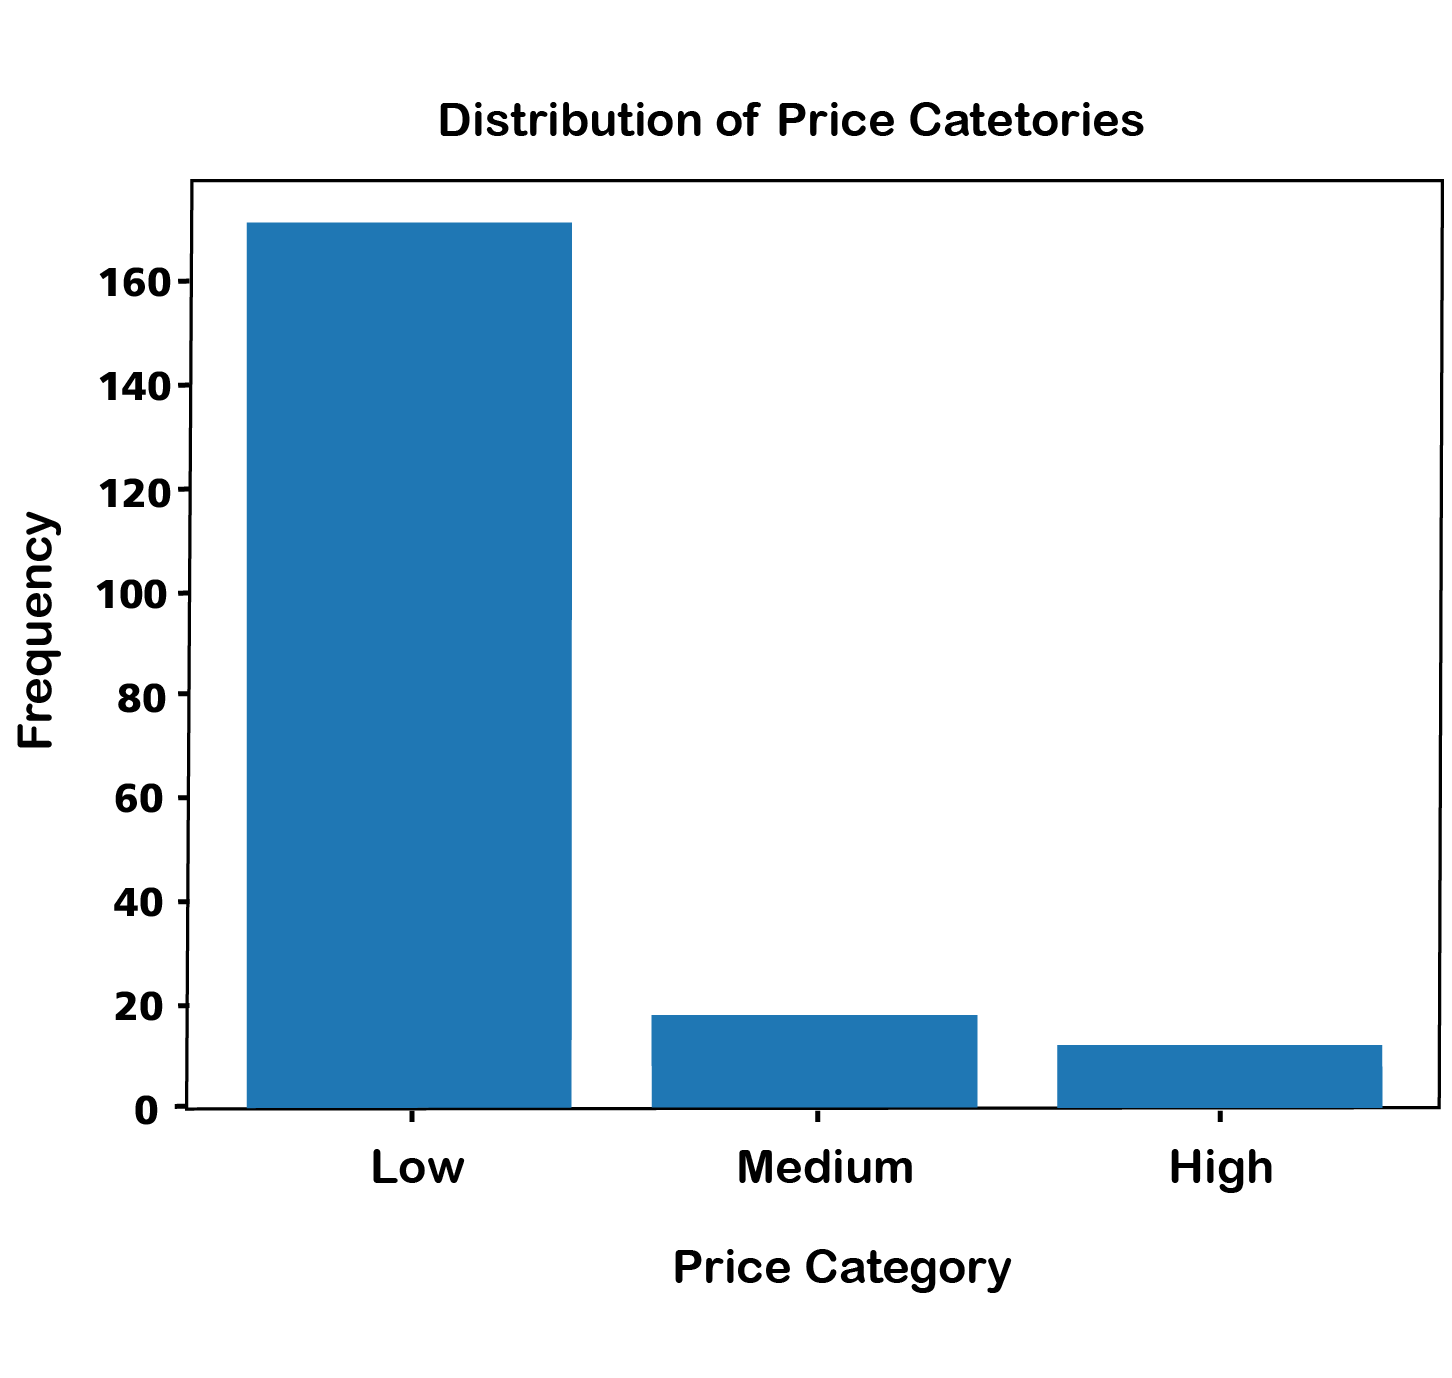
import matplotlib.pyplot as plt

# Replace '?' with np.nan
df.replace("?",float("nan"),inplace=True)

# Convert 'price' to numeric, coercing any errors to NaN
df['price'] = pd.to_numeric(df['price'], errors='coerce')

# Create a histogram with edgecolor set to black
plt.hist(df['price'].dropna(), bins=4, edgecolor='black')  # 'dropna()' to exclude NaN values for histogram calculation
plt.xlabel('Price')
plt.ylabel('Frequency')
plt.title('Price bins')
plt.show()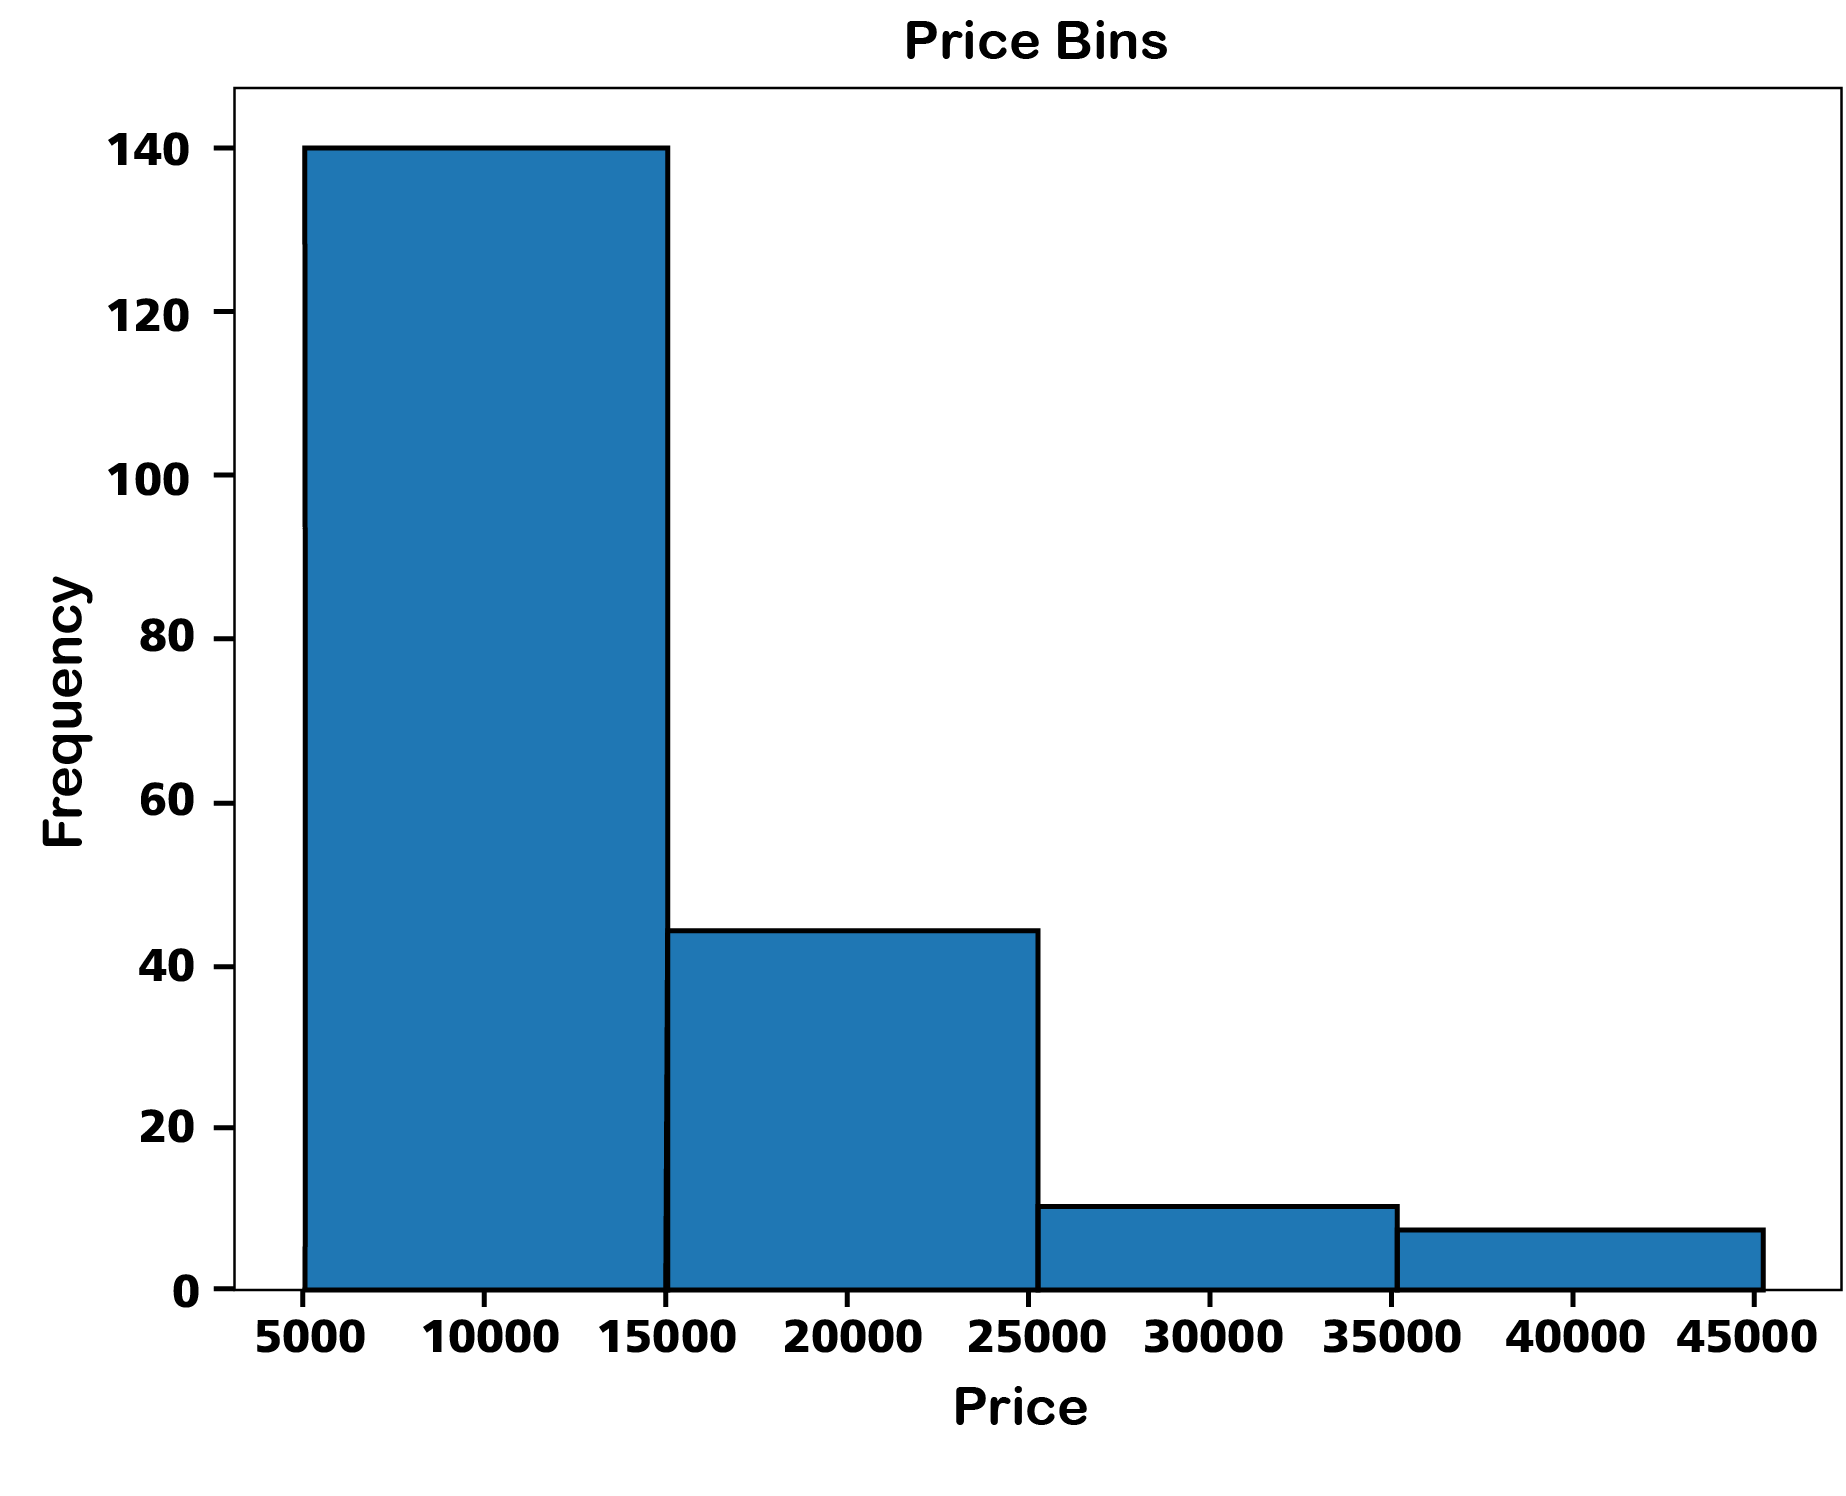
or using pyplot:
df.replace("?", np.nan, inplace = True)

df['horsepower'] = df['horsepower'].astype(float)
df['horsepower'] = df['horsepower'].replace(np.nan, df['horsepower'].mean())

%matplotlib inline
import matplotlib as plt
from matplotlib import pyplot
plt.pyplot.hist(df["horsepower"], bins=4, edgecolor='black')

# set x/y labels and plot title
plt.pyplot.xlabel("horsepower")
plt.pyplot.ylabel("count")
plt.pyplot.title("horsepower bins")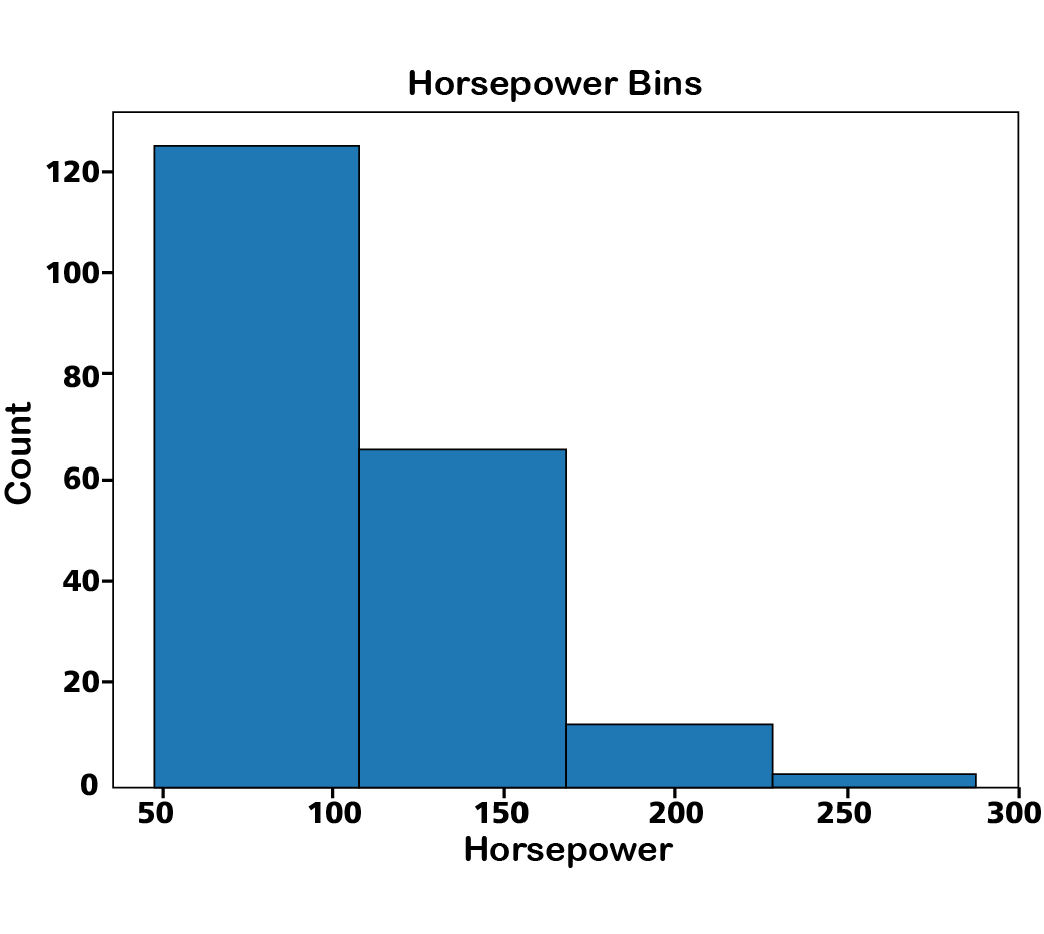
or for a more nuianced look:
# Define bin edges
bins = np.linspace(df['price'].min(), df['price'].max(), 5)

# Create a histogram with specified bin edges, add edge color for distinction
n, bins, patches = plt.hist(df['price'], bins=bins, color='skyblue', edgecolor='black', linewidth=1.2)

# Color each bin differently
colors = ['blue', 'green', 'red', 'purple']
for patch, color in zip(patches, colors):
patch.set_facecolor(color)

plt.xlabel('Price')
plt.ylabel('Frequency')
plt.title('Price Bins')

plt.show()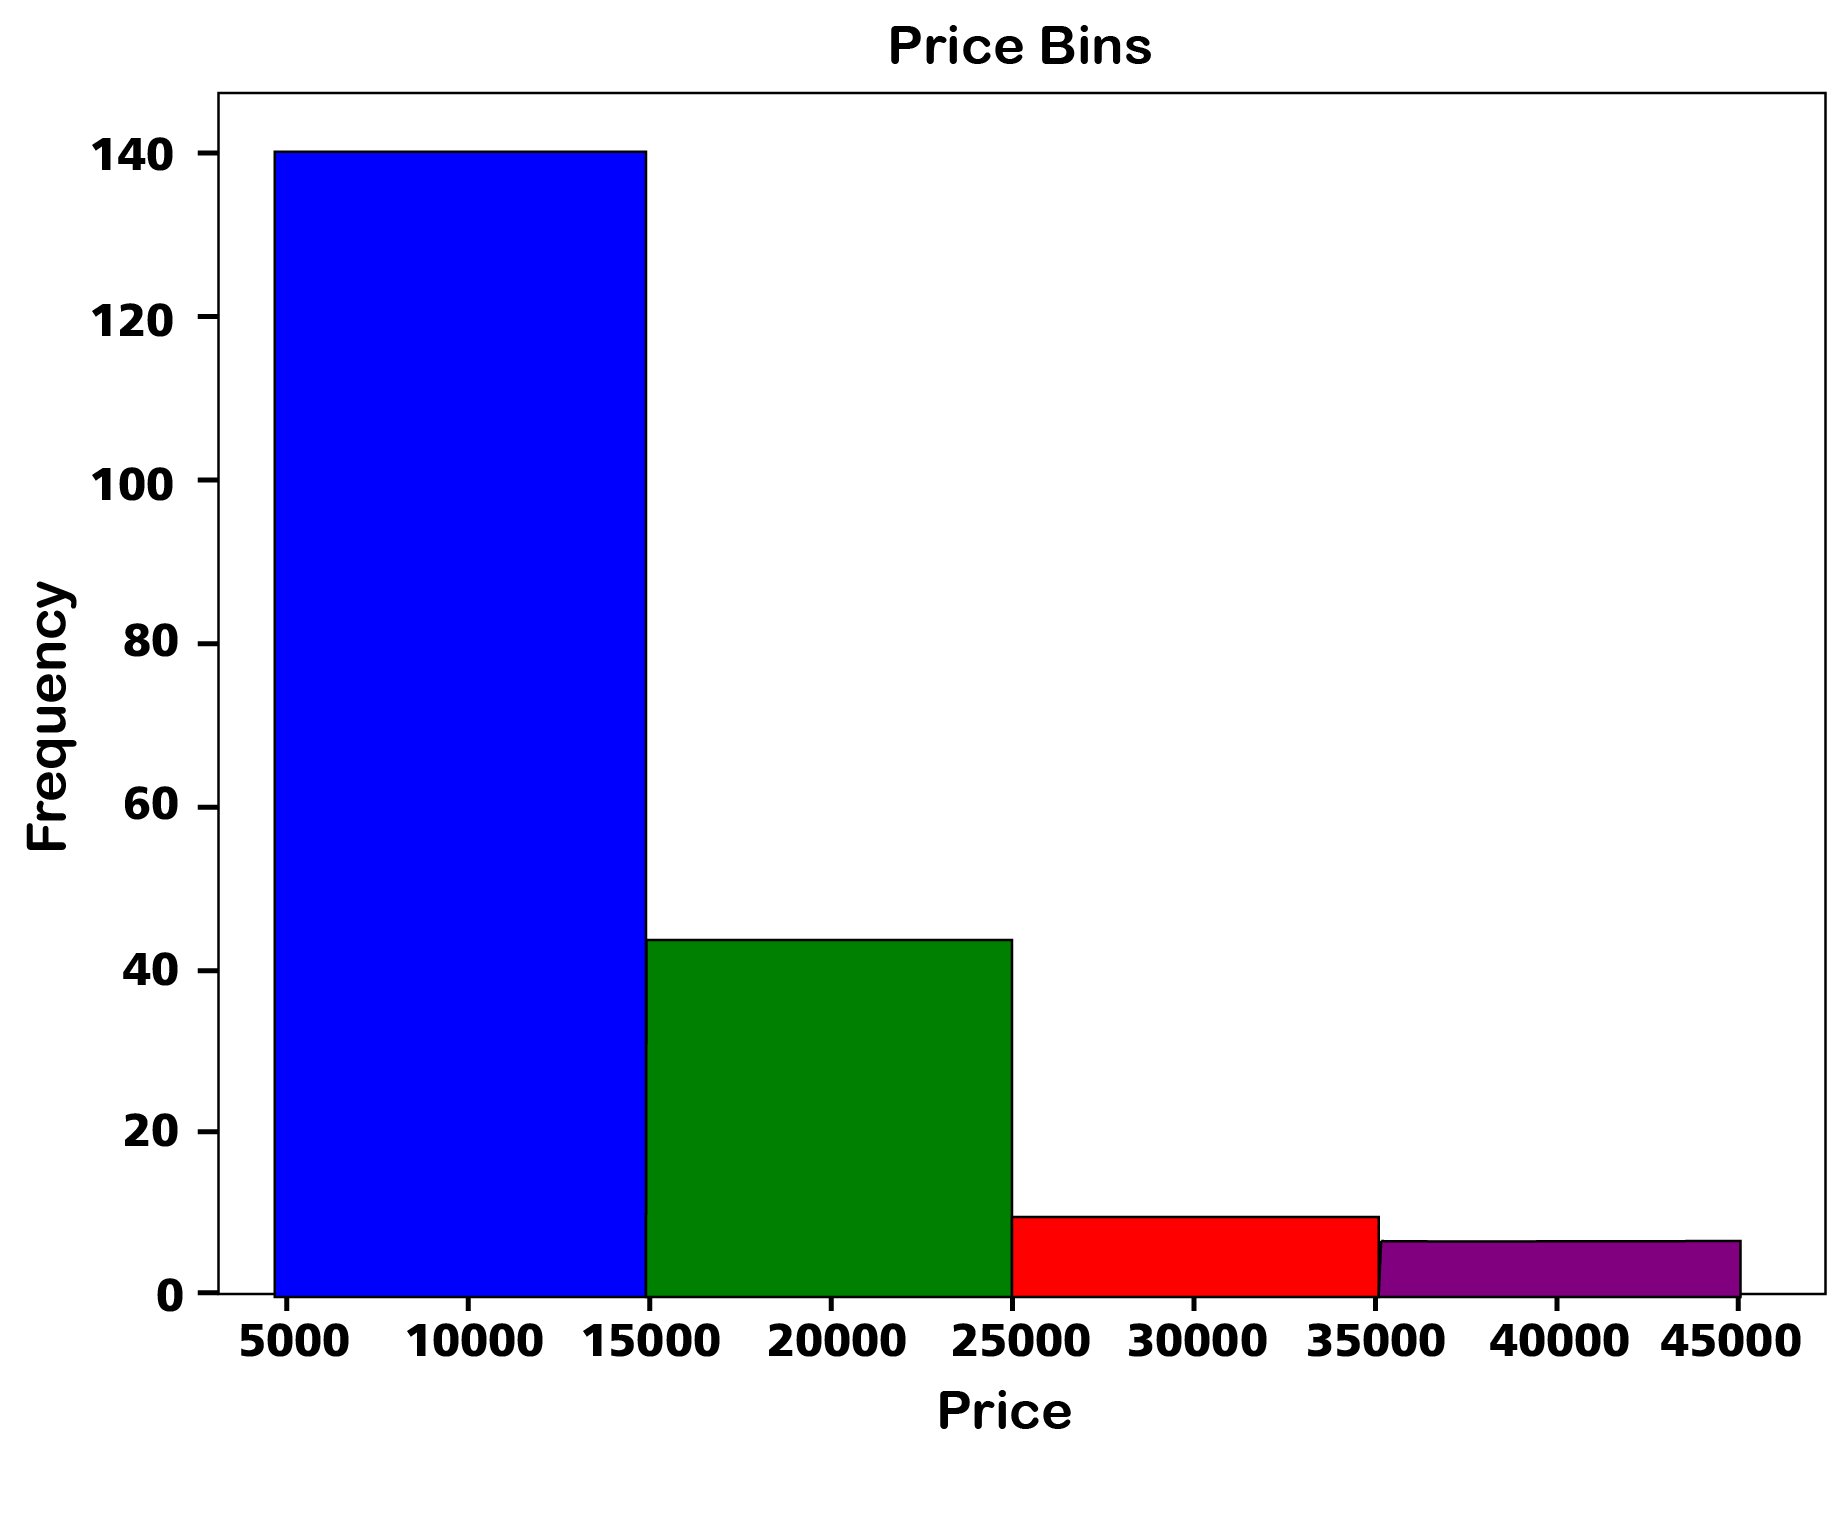
# count the number of 'fuel-type' in the dataframe
df['fuel-type'].value_counts()

# create dummies for fuel-type
dummy = pd.get_dummies(df["fuel-type"])

# change column names for clarity
dummy.rename(columns={'gas':'fuel-type-gas', 'diesel':'fuel-type-diesel'}, inplace=True)

# change the values in dummy to 0 and 1
dummy = dummy.astype(int)

# merge data frame "df" and "dummy"
df = pd.concat([df, dummy], axis=1)

# drop original column "fuel-type" from "df"
df.drop("fuel-type", axis = 1, inplace=True)

# print 'fuel-type-diesel' and 'fuel-type-gas' columns
df[['fuel-type-diesel', 'fuel-type-gas']].head()import pandas as pd
import numpy as np
url="https://cf-courses-data.s3.us.cloud-object-storage.appdomain.cloud/IBMDeveloperSkillsNetwork-DA0101EN-Coursera/laptop_pricing_dataset_mod1.csv"
df=pd.read_csv(url)
df.columns
# round the numbers to 2 decimal places for 'Screen_Size_cm' using np
df['Screen_Size_cm'] = np.round(df['Screen_Size_cm'], 2)
df['Screen_Size_cm'].head()import pandas as pd
import numpy as np
url="https://cf-courses-data.s3.us.cloud-object-storage.appdomain.cloud/IBMDeveloperSkillsNetwork-DA0101EN-Coursera/laptop_pricing_dataset_mod1.csv"
df=pd.read_csv(url)
# the number of rows and columns
df.shape
# convert '?' to NaN
df.replace("?", np.nan, inplace = True)
# count the missing data
missing_data = df.isnull().sum()
# columns with missing data
missing_data[missing_data > 0]
num = pd.Series([4, 5], index=['Screen_Size_cm', 'Weight_kg'])
length = 238
# Iterate over the Series items and print each fraction
for index, value in num.items():
print(f"{index}: {value}/{length}") Screen_Size_cm: 4/238
Weight_kg: 5/238
Weight_kg: 5/238