Examining data
- loading data with or without headers:
# load with header
data = pd.read_csv('data.csv') # same as pd.read_csv('data.csv', header=0)

# load without header
data = pd.read_csv('data.csv', header=None)
- examine the first or the last 'n' rows of data:
# examine the first 5 rows of data
df.head()

# examine the first 10 rows of data:
df.head(10)

# examine the last 5 rows of data:
df.tail()

#examime the lst 15 rows of data:
df.tail(15)
- subsetting a dataset:
# You can subset the first three rows of the first 5 columns like this:
subset_df = df.iloc[0:3, 0:5]
- adding column names:
import pandas as pd

data = [[1, 'Alice', 30], [2, 'Bob', 25], [3, 'Charlie', 35]]
columns = ['ID', 'Name', 'Age']

df = pd.DataFrame(data, columns=columns)

print(df)
df.columns = ['ID', 'Name', 'Age']
df = pd.read_csv('your_file.csv', header=None)  # Reads without using the first row as headers
df.columns = ['ID', 'Name', 'Age']  # Assign your column names
df = pd.read_csv('your_file.csv', names=['ID', 'Name', 'Age'])
- replace all '?' with NaN:
df = df.replace("?", np.nan)
- dtypes: to check the data type of columns
import pandas as pd

data = {'A': [1,2,3,4,5],
        'B': [1.1,2.2,3.3,4.4,5.5],
        'C': ['a','b','c','d','e']}

df = pd.DataFrame(data)

print(df.dtypes)
A      int64
B      float64
C      object
dtype: object
- data types:
-
Object: In Python, the object data type refers to any object.
When a variable is of type object, it can hold any type of data. It
is the most general data type and can represent any Python object.
-
Float: The float data type represents floating-point numbers,
which are numbers that have a decimal point. Floats can represent
both whole numbers and fractions. For example, 3.14 and -0.5 are
floats.
-
Float64: float64 refers to a 64-bit floating-point data type.
It represents double-precision floating-point numbers according to
the IEEE 754 standard. float64 can represent a wide range of real
numbers with high precision, making it suitable for most numerical
computations requiring floating-point arithmetic.
In NumPy, the int64 and float64 data types are commonly used to
store arrays of integers and floating-point numbers, respectively.
These data types provide efficient storage and arithmetic operations
for numerical computations, making them essential for scientific
computing, data analysis, and machine learning applications in
Python.
-
Int: The int data type represents integers, which are whole
numbers without any decimal point. Integers can be positive,
negative, or zero. For example, 5, -10, and 0 are integers.
-
Int64: int64 refers to a 64-bit integer data type. It
represents whole numbers that can range from -9223372036854775808 to
9223372036854775807 on a standard 64-bit system. The int64 data type
is commonly used when working with large integers or when explicit
control over integer size is necessary.
-
Bool: The bool data type represents Boolean values, which can
either be True or False. Booleans are often used in control flow
statements and logical operations. For example, True and False are
bools.
-
Datetime64: The datetime64 data type is specific to the
pandas library, which is commonly used for working with time series
data. It represents date and time values with nanosecond precision.
It allows for convenient manipulation and analysis of dates and
times. For example, 2024-02-11 12:30:00 is a datetime64 object.
-
describe(): computes count, mean, standard deviation, minimum,
maximum, and quartile values for each numeric column
Result :
              A         B
    count  5.000000  5.000000
    mean   3.000000  3.300000
    std    1.581139  1.739253
    min    1.000000  1.100000
    25%    2.000000  2.200000
    50%    3.000000  3.300000
    75%    4.000000  4.400000
    max    5.000000  5.500000
-
include='all' : includes all columns, both numeric and
non-numeric
print(df.describe(include='all'))
               A         B    C
    count   5.000000  5.000000    5
    unique       NaN       NaN    5 # Number of unique values in the column
    top          NaN       NaN    a # Most frequently occurring value
    freq         NaN       NaN    1 # Frequency of the most frequently occurring value
    mean    3.000000  3.300000  NaN
    std     1.581139  1.739253  NaN
    min     1.000000  1.100000  NaN
    25%     2.000000  2.200000  NaN
    50%     3.000000  3.300000  NaN
    75%     4.000000  4.400000  NaN
    max     5.000000  5.500000  NaN
-
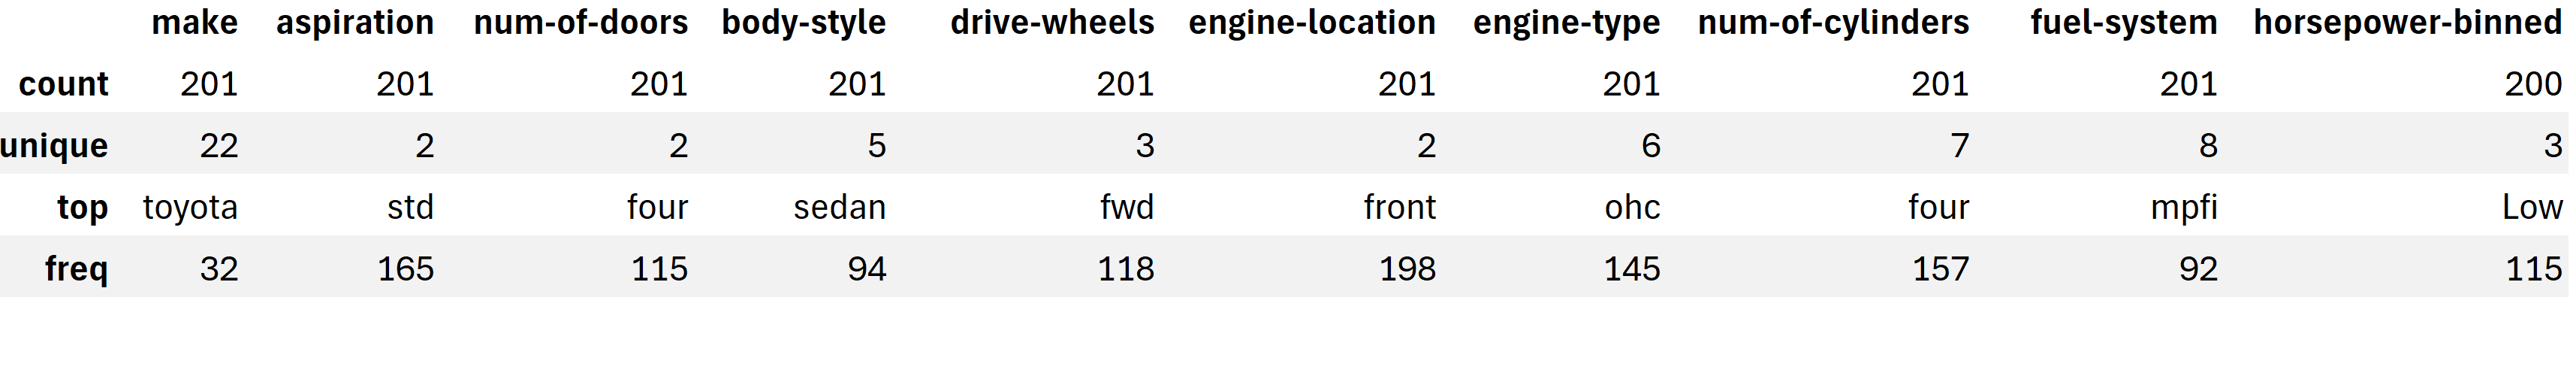
include=['object'] : includes only non-numeric columns
import pandas as pd

url = 'https://cf-courses-data.s3.us.cloud-object-storage.appdomain.cloud/IBMDeveloperSkillsNetwork-DA0101EN-SkillsNetwork/labs/Data%20files/automobileEDA.csv'
df = pd.read_csv(url)

df.describe(include=['object'])
-
describe() for two columns
# import data from the web and store it in a pandas dataframe
url = 'https://cf-courses-data.s3.us.cloud-object-storage.appdomain.cloud/IBMDeveloperSkillsNetwork-DA0101EN-SkillsNetwork/labs/Data%20files/automobileEDA.csv'
df = pd.read_csv(url)

# quick data check for 'engine-size' and 'price' columns
print(df[['engine-size', 'price']].describe())
-
info(): provides a concise summary of a DataFrame, including
its index dtype and column dtypes, along with memory usage
Result :
RangeIndex: 5 entries, 0 to 4
    Data columns (total 3 columns):
     #   Column  Non-Null Count  Dtype
    ---  ------  --------------  -----
     0   A       5 non-null      int64
     1   B       5 non-null      float64
     2   C       5 non-null      object
    dtypes: float64(1), int64(1), object(1)
    memory usage: 252.0+ bytes
    None
- let's bring in data from the web:
import pandas as pd

url="https://archive.ics.uci.edu/ml/machine-learning-databases/autos/imports-85.data"
df=pd.read_csv(url, header=None)

headers=['symboling', 'normalized-losses', 'make', 'fuel-type', 'aspiration',
         'num-of-doors', 'body-style', 'drive-wheels', 'engine-location',
         'wheel-base', 'length', 'width', 'height', 'curb-weight', 'engine-type',
         'num-of-cylinders', 'engine-size', 'fuel-system', 'bore', 'stroke',
         'compression-ratio', 'horsepower', 'peak-rpm', 'city-mpg',
         'highway-mpg', 'price']

df.columns=headers
print(df.columns)
-
to show column names on the next line (\n) after "column names:":
print("column names:\n", headers)
column names:
     ['symboling', 'normalized-losses', 'make', 'fuel-type', 'aspiration', 'num-of-doors', 'body-style', 'drive-wheels',
    'engine-location', 'wheel-base', 'length', 'width', 'height', 'curb-weight', 'engine-type', 'num-of-cylinders', 'engine-size',
    'fuel-system', 'bore', 'stroke', 'compression-ratio', 'horsepower', 'peak-rpm', 'city-mpg', 'highway-mpg', 'price']
to show column names in a data frame:
dfc=pd.DataFrame(df.columns)
print(dfc)
# List to hold names of columns with '?'
columns_with_question_mark = []

# Iterate through each column in DataFrame
for column in df.columns:

# Check if any row in the column contains '?'
if df[column].astype(str).str.contains('\?').any():

# If found, add the column name to the list
columns_with_question_mark.append(column)

# Display the list of column names
print(columns_with_question_mark)
filtered_df = df[df['horsepower'] != '?']
print(filtered_df)
# Filter rows where '?' is not present in any of the columns
filtered_df = df[~df.apply(lambda row: '?' in row.values, axis=1)]

# Now, 'filtered_df' contains rows where '?' is not present in any of the columns
print(filtered_df)
df.replace('?',np.nan, inplace = True)
#'inplace = True' specifies the operation should be performed on the DataFrame in place
df1=df.replace('?',np.NaN)
df=df1.dropna(subset=["price"], axis=0)
df.head(5)
# Drop a column
column_name_to_drop = 'symboling'
df.drop(column_name_to_drop, axis=1, inplace=True)

# Now, the specified column has been dropped from the DataFrame
print(df)
selected_columns = df[['Column1', 'Column3', 'Column7']]
selected_columns = df.iloc[:, [1, 3, 7]]
#iloc[] is used for selection by integer location.
#[:, [1, 3, 7]] specifies all rows (:) and the columns at positions 1, 3, and 7.
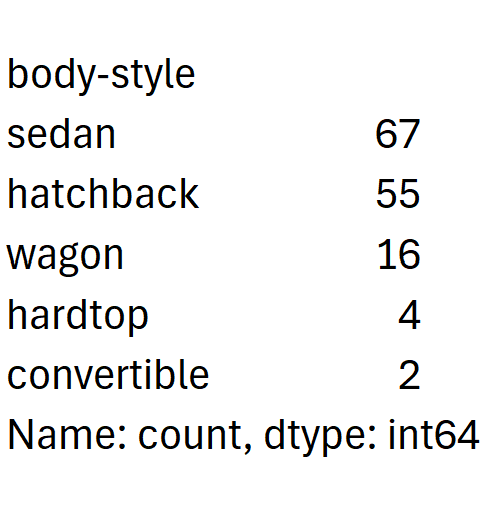
gas_cars = df[df['fuel-type'] == 'gas']
count_by_body_style = gas_cars['body-style'].value_counts()